
Halton luxury market report.
Every active MLS® listing above $2 million in Halton as of September 12, 2026, refreshed hourly from the CREA feed. No estimates, no rounding to a story.
Across the whole GTA: 2,643 active, median asking $2.9M, $1,000/sq ft. Halton median asking is 105% of the GTA figure.
Newest to market
The most recent $2M+ arrivals in Halton.
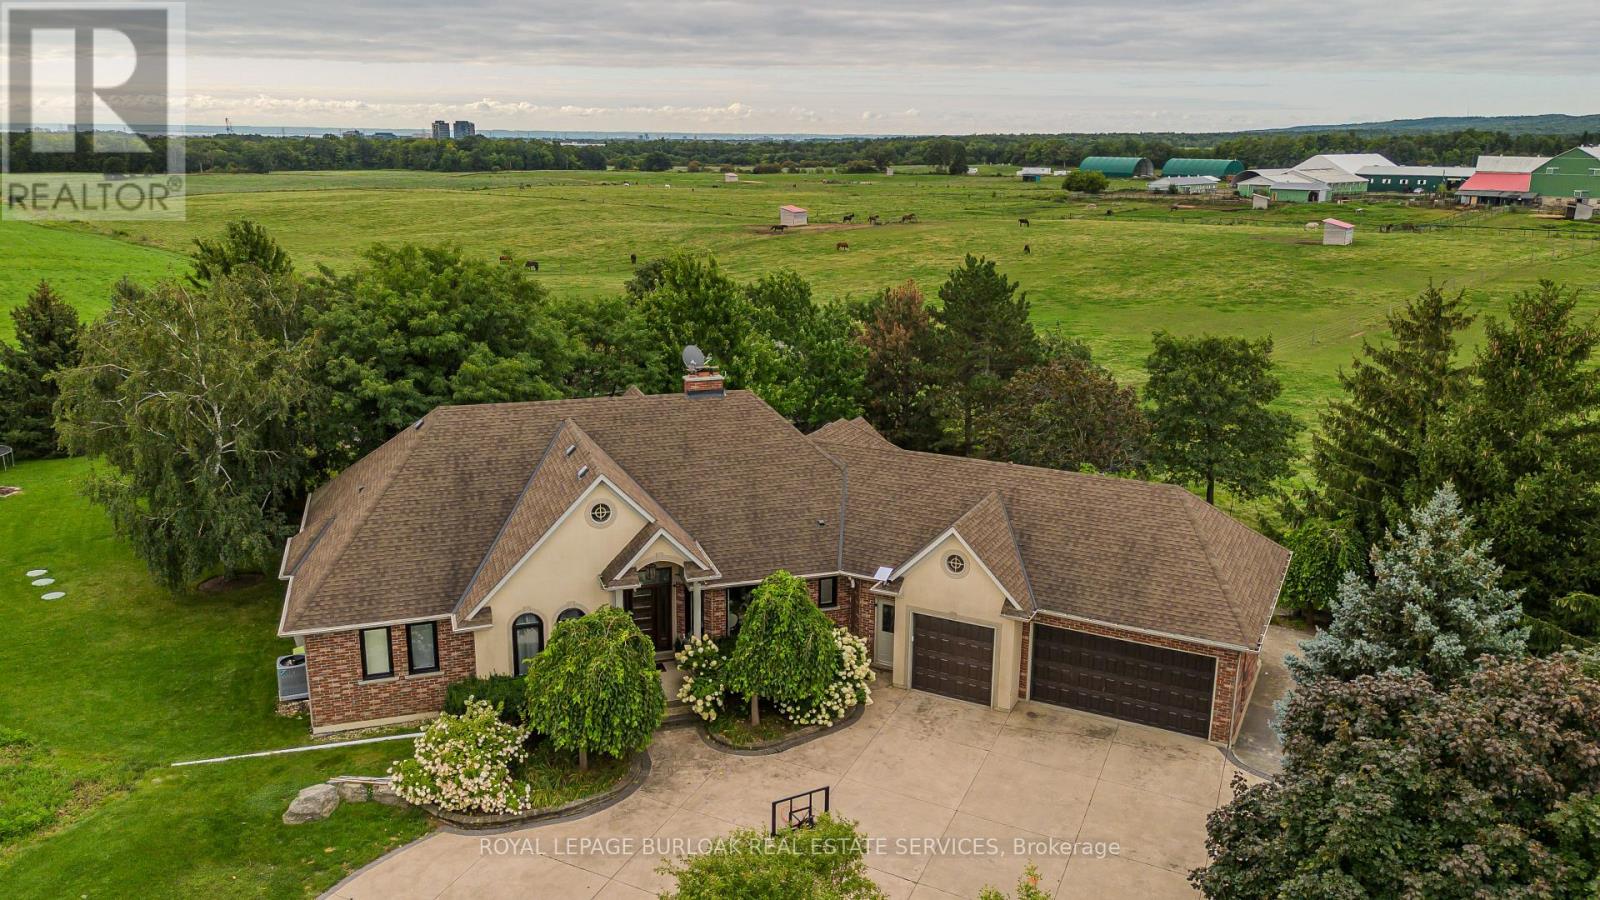
5200 2 Side Road
Listed Sep 12 · Courtesy of ROYAL LEPAGE BURLOAK REAL ESTATE SERVICES
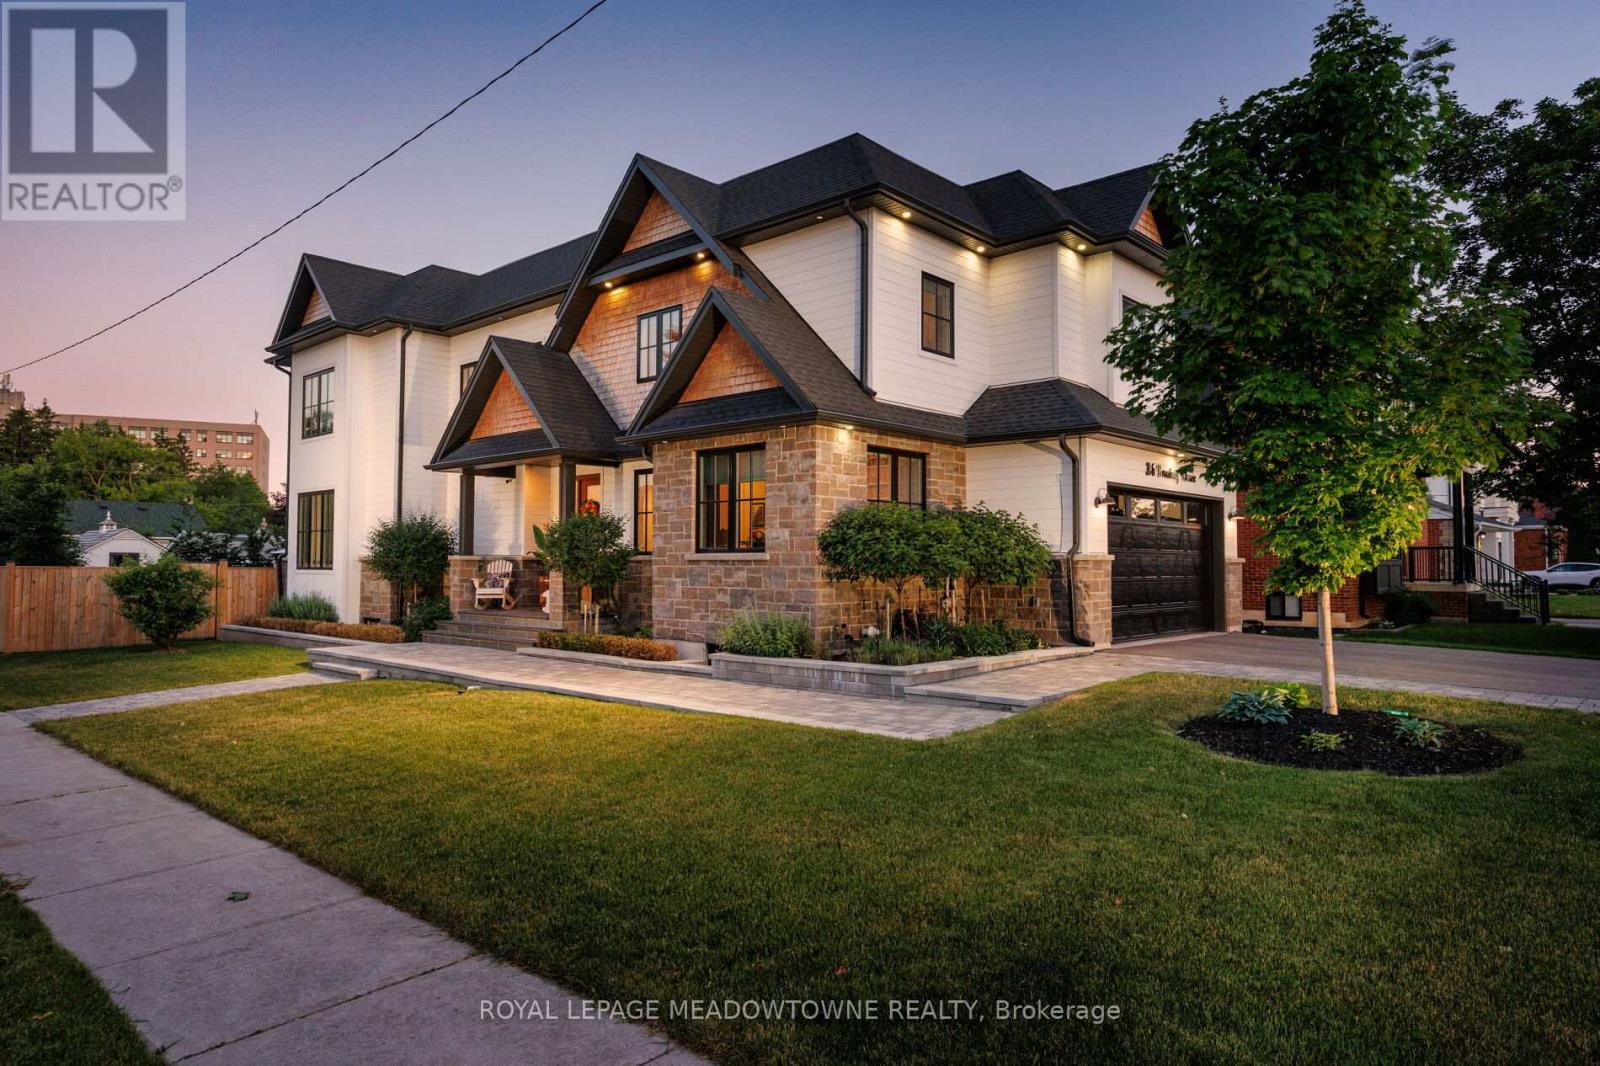
396 Broadway Avenue
Listed Sep 12 · Courtesy of ROYAL LEPAGE MEADOWTOWNE REALTY
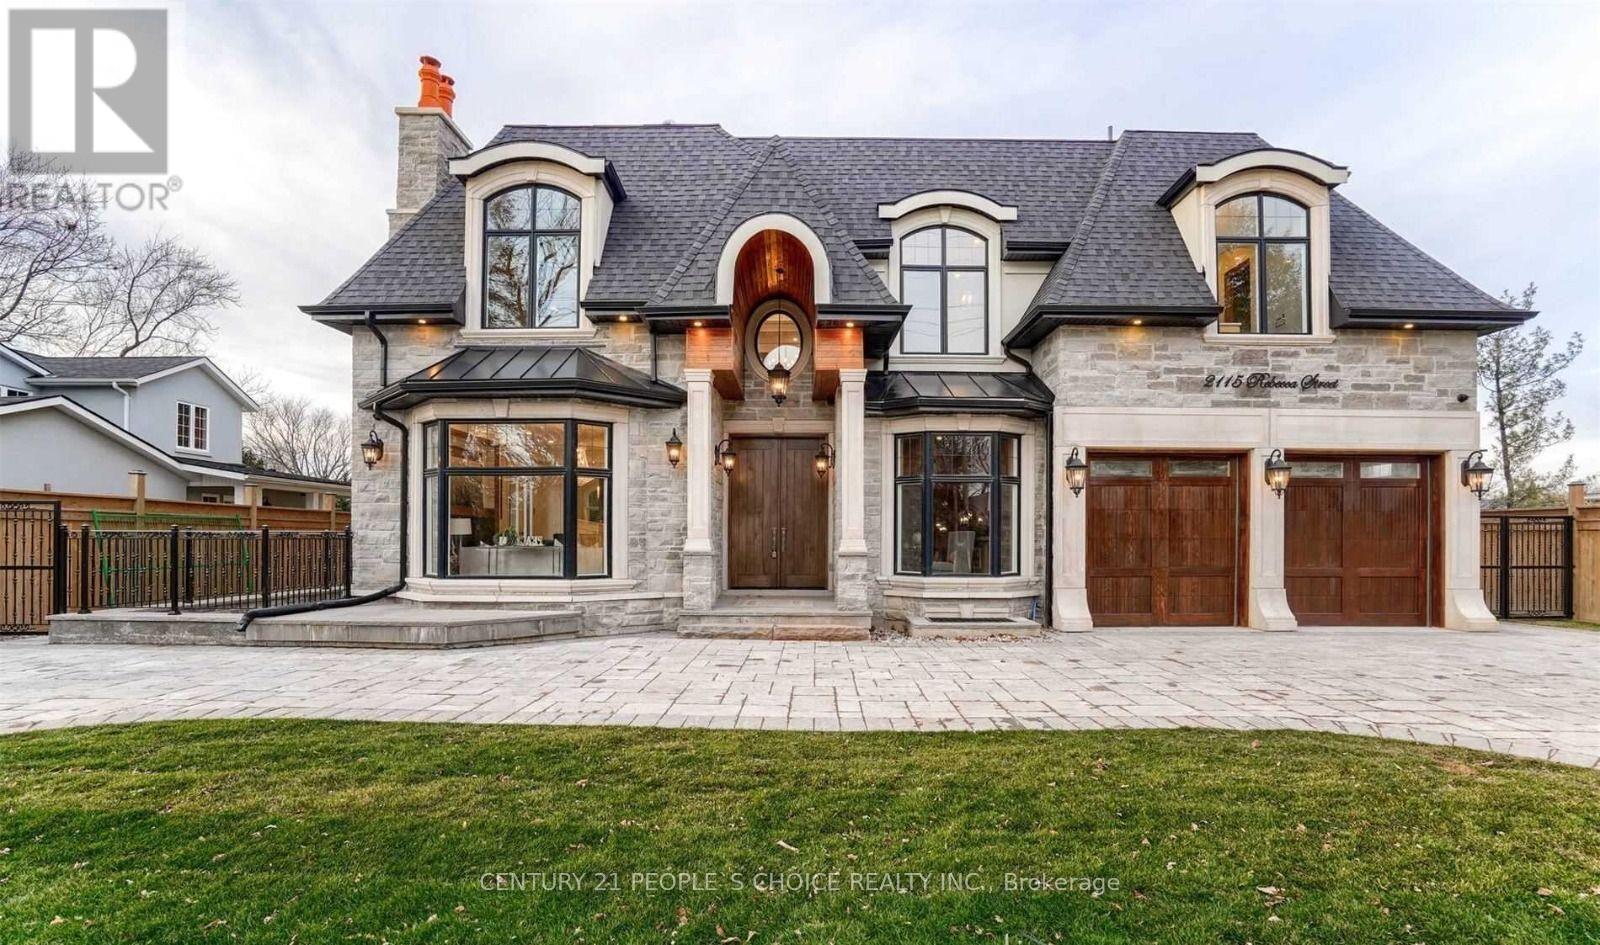
2115 Rebecca Street
Listed Sep 12 · Courtesy of CENTURY 21 PEOPLE'S CHOICE REALTY INC.
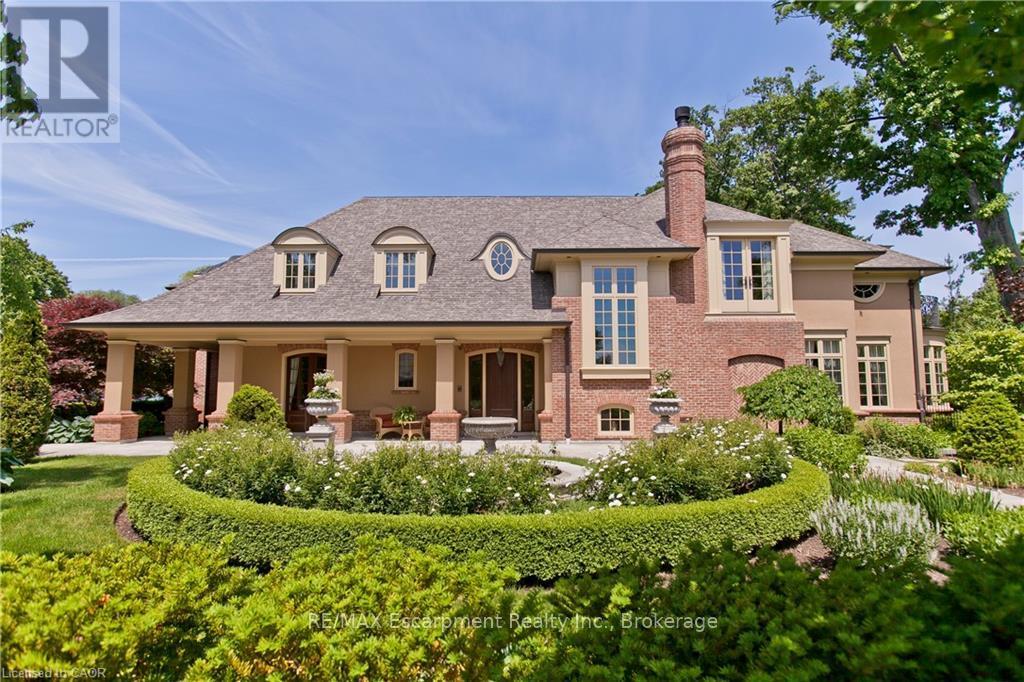
1081 Argyle Drive
Listed Sep 12 · Courtesy of RE/MAX Escarpment Realty Inc., Brokerage
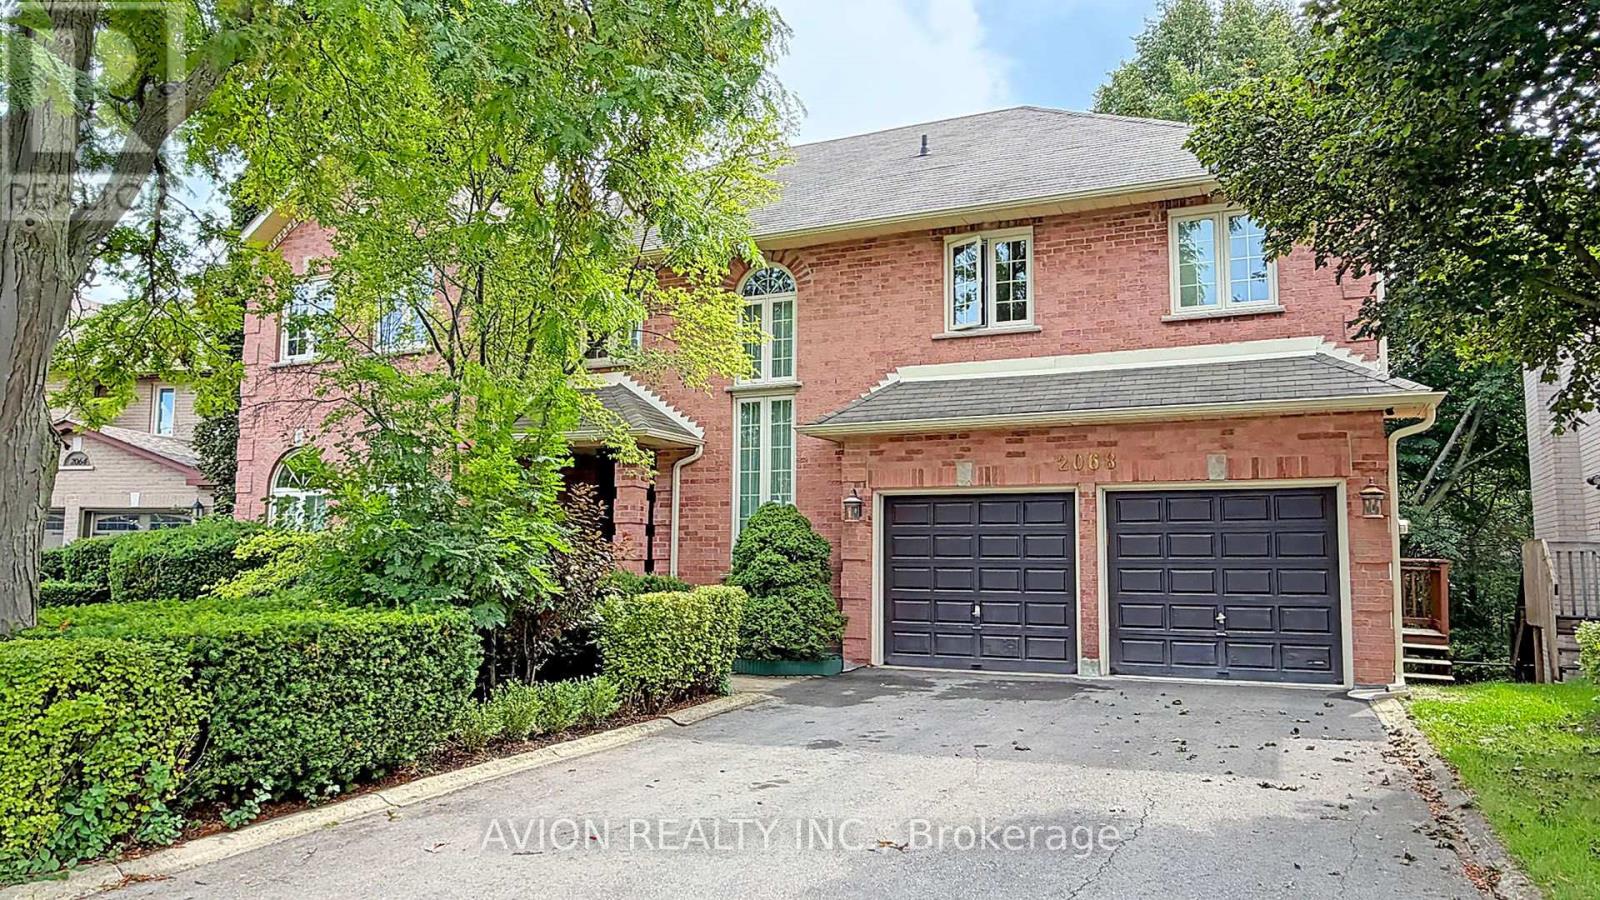
2068 Nipigon Drive
Listed Sep 12 · Courtesy of AVION REALTY INC.
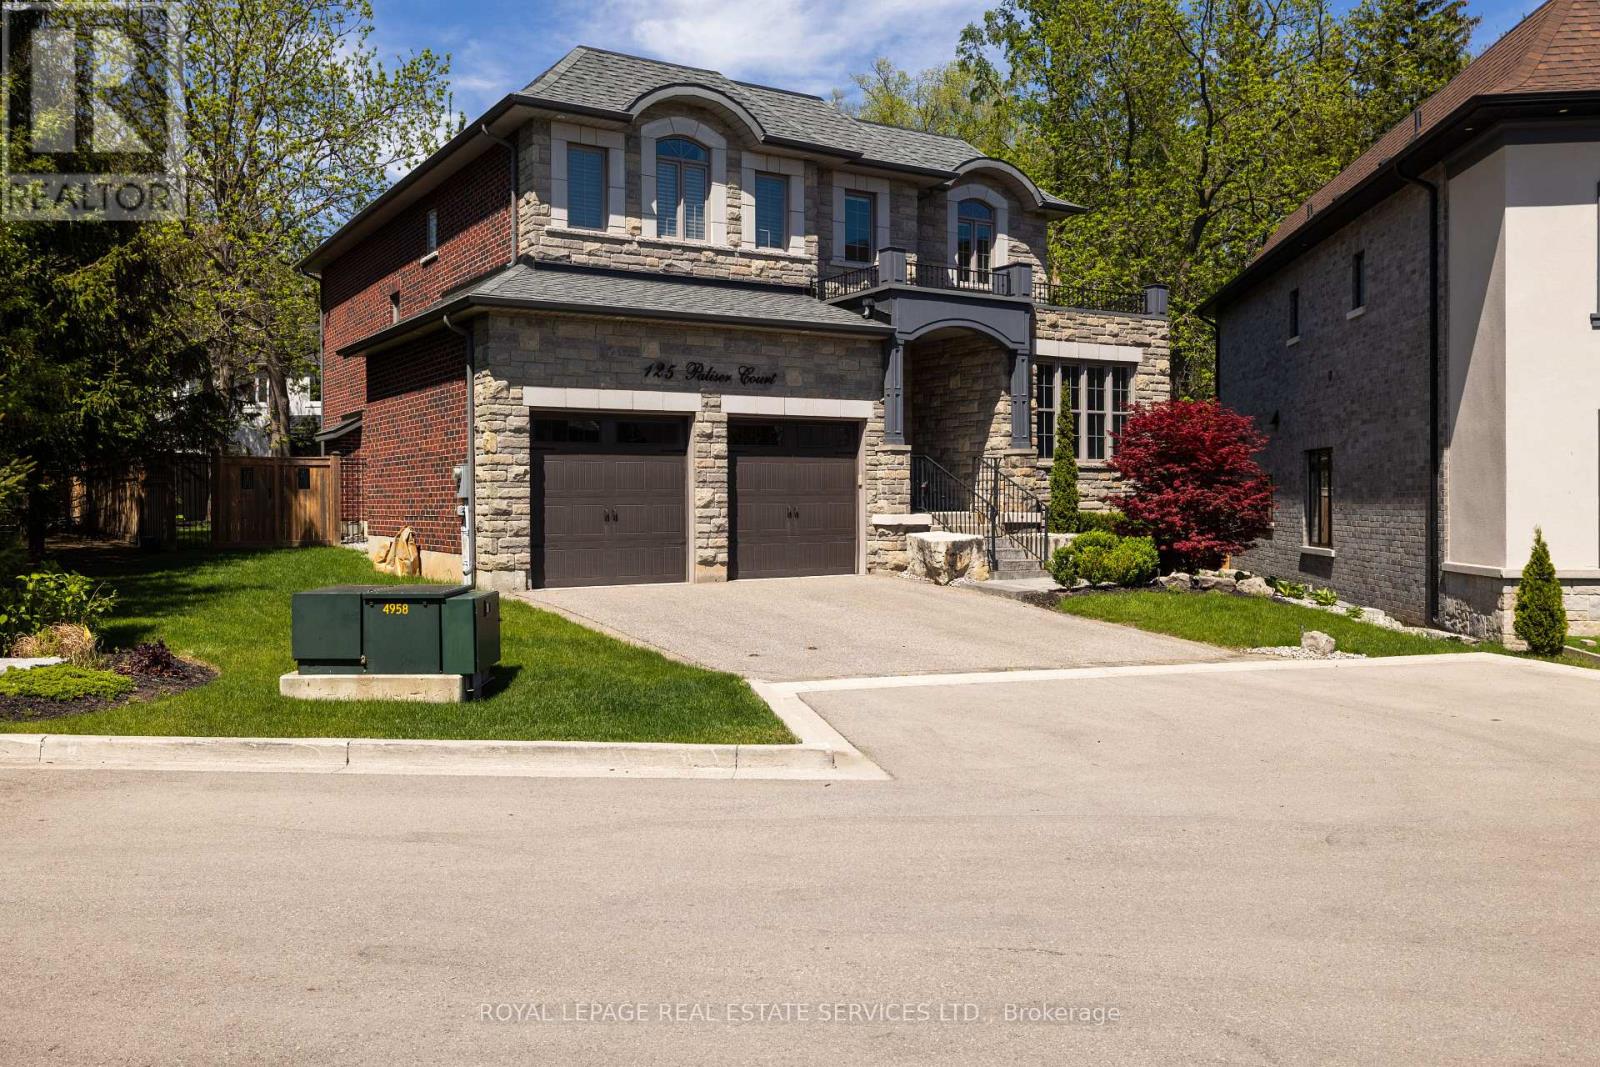
125 Paliser Court
Listed Sep 11 · Courtesy of ROYAL LEPAGE REAL ESTATE SERVICES LTD.
Highest asking prices in Halton
Halton by the numbers
Swipe sideways for every column
| Region | Active | $5M+ | Median asking | Median $/sq ft | New this week | Median days listed |
|---|---|---|---|---|---|---|
| Halton | 358 | 57 | $3.1M | $1,083 | 35 | 57.5 |
Most active cities
Cities with the deepest $2M+ inventory right now.
- Oakville226 active · $3.1M median · $1,098/sq ft
- Burlington60 active · $3.3M median · $1,096/sq ft
- Milton38 active · $3.3M median · $1,035/sq ft
- Halton Hills34 active · $2.9M median · $999/sq ft
Where $5M buys the most house
Median asking price per square foot among $4M to $7M homes. Lower is more house. MLS® publishes size in bands, so each figure is the most the rate can be.
- 01Milton$1,219/sq ft · 6 homes
- 02Halton Hills$1,227/sq ft · 8 homes
- 03Burlington$1,298/sq ft · 17 homes
- 04Oakville$1,400/sq ft · 35 homes
A private read on the street you are watching.
Comparable sales, what actually closed, and what is coming to market quietly. Prepared for clients, not published.
Private consultation →Source: active MLS® listings above $2,000,000 across the GTA via the CREA Data Distribution Facility, as displayed on this site. Asking prices, not sales. Square footage as published by the listing brokerage in bands (for example "5000+"), never as an exact figure; every $/sq ft number here is therefore a ceiling — the true rate is lower wherever a home exceeds its band. Days listed from the listing's original entry date where provided.